Why Indicators Matter in NinjaTrader 8
Technical indicators are the foundation of systematic trading in NinjaTrader 8. They transform raw price data into actionable signals, helping traders identify trends, gauge momentum, and time their entries and exits with greater precision.
But with hundreds of indicators available, choosing the right ones can be overwhelming. Professional traders know that more indicators don't mean better results. Instead, success comes from understanding a focused set of indicators that complement each other and match your trading style.
In this guide, we'll cover the most effective indicators for NinjaTrader 8 in 2026, organized by category. Whether you're building automated grid strategies or discretionary trading setups, these indicators will give you an edge.
Indicator Categories We'll Cover
- Volume Indicators: Reveal institutional activity and price validation
- Momentum Indicators: Measure speed and strength of price moves
- Trend Indicators: Identify market direction and trend strength
- Volatility Indicators: Gauge market conditions and set stop distances
Volume Indicators
Volume is the one indicator that can't lie. Price can be manipulated, but volume shows where real money is flowing. Volume indicators help validate price moves and identify potential reversals before they happen.
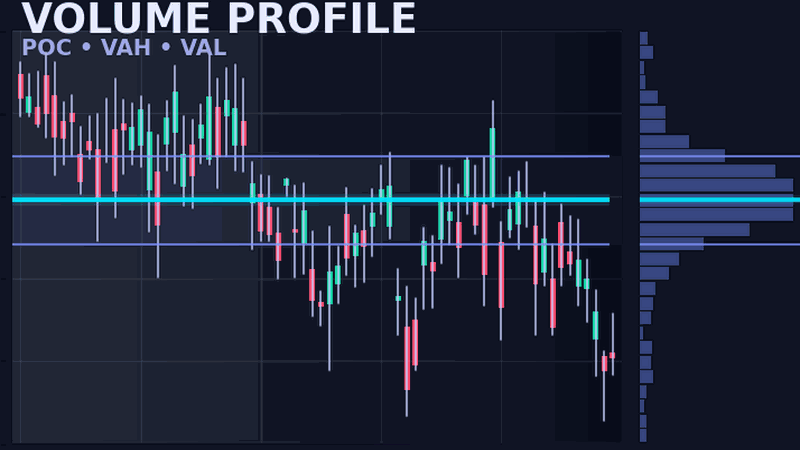
Volume Profile
Volume Profile shows the distribution of trading volume at specific price levels rather than time periods. This reveals where institutional traders have built positions and where price is likely to find support or resistance.
Key Levels to Watch
- Point of Control (POC): The price level with the highest volume - acts as a magnet
- Value Area High/Low: Bounds 70% of volume - natural support and resistance
- Low Volume Nodes: Price moves quickly through these areas
Volume Profile is particularly useful for mean reversion strategies, as price tends to return to high-volume nodes where fair value is established.
VWAP (Volume Weighted Average Price)
VWAP calculates the average price weighted by volume throughout the trading session. Institutional traders use VWAP as a benchmark for execution quality, making it a self-fulfilling prophecy for support and resistance.
Bullish Signals
Price holding above VWAP indicates buyers are in control. Pullbacks to VWAP often provide low-risk entry points in uptrends.
Bearish Signals
Price staying below VWAP shows sellers dominate. Rallies to VWAP become selling opportunities in downtrends.
Pro tip: Use VWAP bands (standard deviations from VWAP) for dynamic overbought/oversold levels that adjust to current market conditions.
Momentum Indicators
Momentum indicators measure the rate of change in price, helping you identify when moves are accelerating or losing steam. They're essential for timing entries and spotting potential reversals.
RSI (Relative Strength Index)
RSI measures the speed and magnitude of recent price changes on a scale of 0-100. While the classic interpretation uses 70 as overbought and 30 as oversold, professional traders use RSI more nuanced ways.
Professional RSI Techniques
- Divergence: Price making new highs while RSI makes lower highs signals weakness
- Range shift: In strong uptrends, RSI oscillates between 40-80; in downtrends, 20-60
- Failure swings: RSI failing to reach prior extremes can signal trend change
RSI works exceptionally well with mean reversion strategies, providing objective entry signals when price deviates from equilibrium.
MACD (Moving Average Convergence Divergence)
MACD shows the relationship between two exponential moving averages, revealing both trend direction and momentum. The histogram component is particularly useful for timing entries.
Standard Settings
12, 26, 9 (fast EMA, slow EMA, signal line). Works well on daily charts for swing trading.
Day Trading Settings
8, 17, 9 or 5, 13, 6 for faster signals on intraday charts. Adjust based on your timeframe.
The MACD histogram shrinking toward zero often precedes trend changes - watch for histogram divergence from price for early reversal signals.
Master These Strategy Techniques
Learn how professional traders combine these indicators with proven strategies like grid trading and trend following.
Trend Indicators
"The trend is your friend" remains one of trading's most enduring truths. Trend indicators help you identify market direction and stay on the right side of momentum.
Moving Averages
Moving averages smooth price data to reveal the underlying trend. The key is choosing the right type and period for your trading style.
| Type | Best For | Common Periods |
|---|---|---|
| SMA | Identifying major trend direction | 50, 100, 200 |
| EMA | Faster signals, day trading | 9, 21, 50 |
| VWMA | Volume-weighted trend analysis | 20, 50 |
A classic setup: Use the 200 SMA for trend direction, 50 EMA for intermediate trend, and 9/21 EMA crossovers for entries. This multi-timeframe approach is fundamental to trend following strategies.
ADX (Average Directional Index)
ADX measures trend strength regardless of direction, making it invaluable for distinguishing trending from ranging markets. This helps you know when to apply trend-following strategies versus mean reversion.
ADX Interpretation
- Below 20: Weak or no trend - favor range-bound strategies like grid trading
- 20-25: Emerging trend - prepare for breakout
- Above 25: Strong trend - use trend-following approaches
- Above 50: Extremely strong trend - potential exhaustion coming
Combine ADX with +DI/-DI (directional indicators) to determine trend direction along with strength.
Volatility Indicators
Volatility indicators help you adapt to changing market conditions. They're essential for position sizing, setting stop-losses, and identifying potential breakouts.
ATR (Average True Range)
ATR measures market volatility by calculating the average range between high and low prices. Unlike other volatility measures, ATR accounts for gaps, making it more reliable for futures trading.
Stop Loss = Entry Price - (ATR * Multiplier)
Example: ES at 5000, 14-period ATR = 25 points
With 2x multiplier: Stop = 5000 - (25 * 2) = 4950
ATR-based stops adapt to market conditions - wider during volatile periods, tighter during quiet markets. This is the foundation of position sizing in professional grid trading systems.
Bollinger Bands
Bollinger Bands plot standard deviation bands around a moving average, creating dynamic support and resistance levels that expand and contract with volatility.
Mean Reversion Setup
When bands are wide and price touches the outer band, look for reversal candles to fade the move back toward the middle band.
Breakout Setup
Band squeeze (narrow bands) precedes explosive moves. Trade the breakout direction when bands expand after a squeeze.
The band squeeze setup is particularly effective for breakout trading strategies, as volatility contraction often precedes significant price moves.
How to Choose the Right Indicators
The biggest mistake traders make is using too many indicators that say the same thing. Here's how to build a balanced indicator toolkit.
The Three-Category Rule
Limit yourself to one indicator from each category to avoid redundancy:
- One trend indicator: Shows market direction (Moving Average or ADX)
- One momentum indicator: Times entries and exits (RSI or MACD)
- One volatility indicator: Sets risk parameters (ATR or Bollinger Bands)
Add a volume indicator if you trade instruments with reliable volume data. This keeps your charts clean and your analysis focused.
Match Indicators to Your Strategy
- Scalping: Fast EMAs (5, 9), RSI(7), ATR for quick volatility reads
- Swing Trading: 50/200 SMA, MACD, Bollinger Bands for multi-day holds
- Grid Trading: Volume Profile, ADX (confirm range), ATR for grid spacing
- Trend Following: 21/50/200 EMA, ADX, ATR for trailing stops
Test Before You Trust
Every indicator works in hindsight. Before adding any indicator to your trading:
- Backtest it on your specific instruments and timeframes
- Paper trade with it for at least 50 trades
- Document when it works and when it fails
- Understand WHY it works, not just that it works
For help with backtesting, see our guide on backtesting NinjaTrader strategies.